Our success as Western Bulldogs
(We can feel pride that we are right up there with Fremantle and Richmond!)
There are some people in the football media who endorse and promote the view of how much we have come along since changing our name from Footscray to Western Bulldogs? Well in what way? It certainly isn’t on the field. A few more isolated finals wins- but still not two consecutive finals victories in the same campaign since the Footscray team that was leading at half time of the 1961 Grand Final.
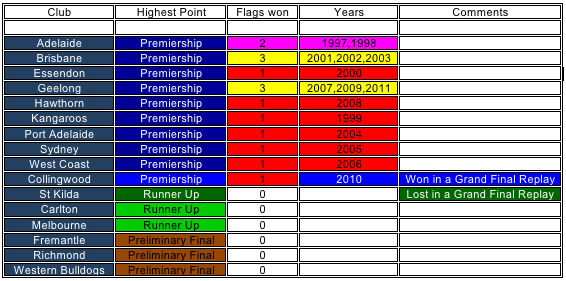
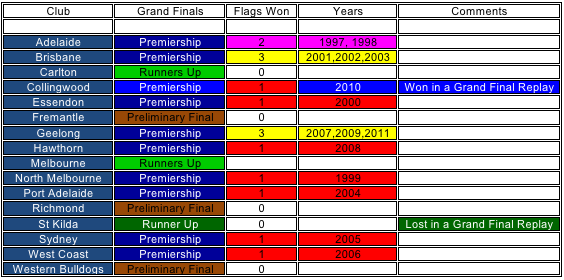
From 1997 the tables below will display the high point of each of the (pre Gold Coast and Greater Western Sydney) 16 AFL clubs.
It has been a reasonably even competition in that time over the 15 seasons. In some years one team has dominated and in others the Premiership has been more closely contested.
In that 15 years –
(a) 10 of the 16 clubs have won a Premiership
(b) 11 of the 16 clubs have walked off at the end of the Grand Final having NOT LOST on that day
(c) 13 of the 16 clubs have played in a Grand Final
(d) 13 of the 16 clubs have won 2 or more finals games in the year that they participated.
All bar 3 of clubs are involved in the statistics above.
(a) Applies to Adelaide, Brisbane, Collingwood, Essendon, Geelong, Hawthorn, North Melbourne, Port Adelaide, Sydney and West Coast. North was known as ‘Kangaroos’ in this case.
(b) Applies to all of the above and St Kilda who walked off the MCG after a Grand Final just like the other 10 did- in that they did NOT LOSE a Grand Final. They did end up runners-up but it was confirmed 7 days later.
(c) Applies to all the above mentioned plus Carlton and Melbourne
(d) Applies to all 13 clubs mentioned in a, b and c.
The three out on their own are Fremantle, Richmond and Western Bulldogs. We are possibly better than those two in that we have lost more Preliminary Finals than both of them! Fremantle have been in the competition since 1995- so there are better comparisons for us than the Fremantle Dockers. Richmond has been chronic underachievers. They have made the finals once in that time and since they finished the 1982 season on top of the ladder and eventual runners-up- just two finals appearances- in 1995 and 2001. So we can laugh at Richmond now if we want to bully someone? Let us taunt them about their 2 finals appearances in 30 years. Well consider this they haven’t played in a Grand Final and won a flag for 30 years. Their last appearance in a Grand Final was 1982- their last flag was 1980- a fair while ago?
Yet 1982/1980 > 1961/1954 and Richmond supporters will (justifiably) throw that back at us- ALWAYS
This chart is compiled in meritocracy order in the time that we have been Western Bulldogs 1997-2011
This is the same chart compiled in alphabetical order 1997-2011
Here is what has happened for each of the 16 clubs
(This does not include Gold Coast or Greater Western Sydney)


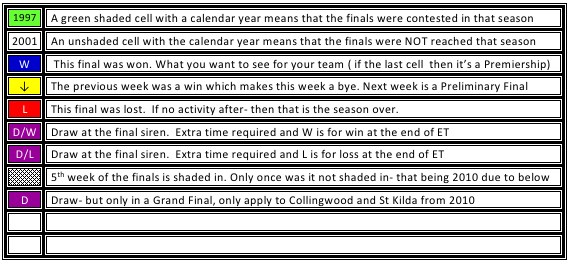
To explain the cell symbols –
The 16 teams in Alphabetical order and how many finals they have all won from 1997-2011
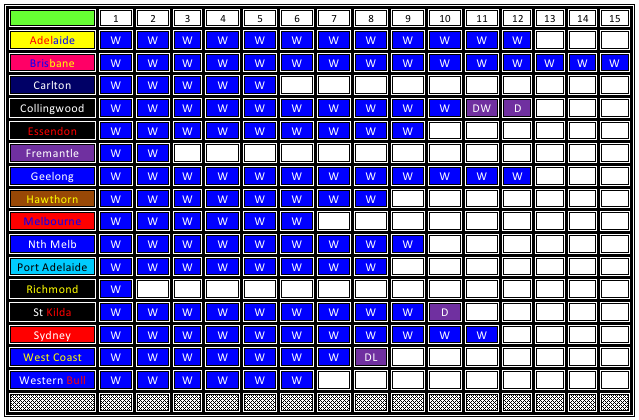
Brisbane has won the most finals matches in the 1997-2011 years.
Adelaide with Geelong has the next highest total of victories.
Richmond has the smallest number of finals wins- one less than Fremantle.
Carlton has 5 wins- they are at number 13 in this ladder.
West Coast and St Kilda have a draw- both were against the same team- Collingwood.
The two draws were different- one an ET decider (West Coast) the other a 7 days later result (St Kilda).
Just scroll down and you will see the ‘ladder’ in this field
The 16 teams in order of most finals wins to least finals wins from 1997-2011.
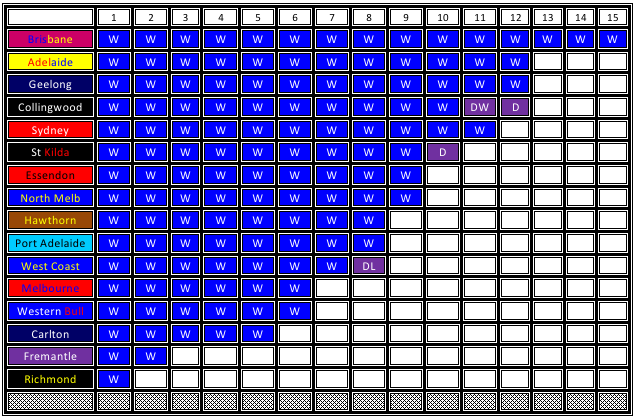
Alphabetical order is used when teams are level on wins.
For example
Adelaide > Geelong
Essendon > North Melbourne
Hawthorn >Port Adelaide
Melbourne > Western Bulldogs
(If we were Footscray then we would be ahead of Melbourne)
As Collingwood have played in more non-losing finals than Sydney, they go above them.
Of their 9 finals wins- 4 were as North Melbourne 5 were as Kangaroos.

